
Ten-Plus Institutions Cited
32 Peer-Reviewed Citations
Every claim on this site traces back to research that existed before Surge Busters did, conducted by people who had never heard of Surge Busters and were never asked to test them.
That's the point. A manufacturer can write anything on a label. What a manufacturer can't do is retroactively recruit NASA, Cambridge University Press, and a dozen university research groups to have already published the physics that happens to match.
This page is the full library, organized by what each body of research actually establishes, not by who funded it (no one here was funded by us).
On This Page
On This Page
- A Note on How to Read This Page
- Quick Reference: Claim to Citation
- The Primary Source: Budwig (2004)
- How We Calculate Surge Force
- Why Floating Baffles Work
- Why Partial Loads Are the Most Dangerous
- Why Fixed Baffles Can't Prevent Rollovers
- Why 96.7% Is the Right Number
- Supporting Research: The Problem, Documented
- Foundational References
A Note on How to Read This Page
None of the researchers listed below were asked by Liquid Surge Control to validate Surge Busters. Most of this work predates Surge Busters, or was conducted independently of any commercial relationship with us.
What they validated, broadly and across many institutions, is that baffles measurably reduce sloshing energy, that surge peaks at partial fill, and that fixed baffles offer no lateral-rollover protection. The narrower claim that a floating design specifically outperforms a fixed one rests on Budwig's test together with Kang et al.'s (2019) floating-baffle study. It has less independent replication behind it than the other findings on this page, and this page says so rather than implying otherwise.
Quick Reference: Claim to Citation
| Surge Busters Claim | Best Supporting Citations |
|---|---|
| 96.7% surge energy eliminated | Budwig (2004), primary. Maleki & Ziyaeifar (2008), Demirel & Aral (2018) confirm baffles drive damping generally, not the 96.7% figure itself. |
| Floating baffles outperform fixed baffles | Kang et al. (2019). Dodge (1971), Stephens (1965), NASA flexible baffle research. Xie & Zhao (2021). |
| Surge peaks at ~52% fill, not full load | Yan & Rakheja (2009). Kolaei, Rakheja & Richard (2014, 2015, 2017). Biswal et al. (2006). |
| Fixed baffles offer zero lateral/rollover protection | Jalili et al. (2020). Otremba et al. (2018). Salem (2000). |
| Partial loads are the most dangerous | Ranganathan, Rakheja & Sankar (1990). Kolaei et al. (2017). Yan & Rakheja (2009). Yu & Chu (2019). |
| The physics is confirmed across 10+ institutions | Concordia University (Rakheja group), West Virginia University (Salem), National Research Council Canada, NASA (multiple programs), Cambridge University Press (Ibrahim, 2005). |
The Primary Source: Budwig, University of Idaho (2004)
Dr. Ralph S. Budwig, Professor and Chair, Department of Mechanical Engineering, University of Idaho, 2,300+ academic citations, ran an independent tilt-table test in 2004, at Liquid Surge Control’s request and at no cost to the company.
Setup1,000-gallon tank, 800 gallons of water, 40 mph emergency stop simulation, coefficient of friction = 0.60 (classified as Wet Asphalt in the site calculator's four-tier road-surface scale; Budwig's report states the value without a wet/dry label).
Result26,480 lbf of surge force without Surge Busters. 860 lbf with Surge Busters installed. A 96.7% reduction.
→ Read the summary: The Science Behind the 96.7%
→ Download the original Budwig study (PDF)
Everything below either independently confirms the physics this test demonstrated, or extends it into related questions: why floating baffles work the way they do, why partial loads are the most dangerous, and why fixed baffles can't address lateral rollover risk.
How We Calculate Surge Force at Any Fill Level or Tank Size
Budwig's report documents one physical measurement: 26,480 lbf without Surge Busters, 860 lbf with Surge Busters, at 80% fill, 1,000 gallons, 40 mph, CoF 0.60. It does not contain a fill-level curve or a per-liquid density formula. Those are ours, built to extend a single measured point into a usable model across any fill level, liquid, or tank size. Speed is deliberately not a variable here, see below. Here is exactly what each piece rests on.
Speed is not a variable
An earlier version of this page scaled surge force as (speed ÷ 40)², on the reasoning that kinetic energy is proportional to velocity squared. That reasoning justifies energy scaling, not force scaling, and the two only coincide under specific braking assumptions. Emergency-braking deceleration is friction-limited, capped by tire-road grip, not by initial speed, which is standard, decades-old material in heavy-vehicle brake testing and accident reconstruction, and is also the modeling convention used in the tank-truck slosh literature itself: Kang, Rakheja & Stiharu (2002) and related studies specify a deceleration level directly (e.g., "0.3g ramp-step") rather than deriving one from speed. Surge force in this model is therefore identical at 40, 55, and 70 mph for a given fill level, liquid, tank size, and road surface, and the site now reports a single reference figure (40 mph, matching Budwig's tested condition) rather than three.
Fill-level dependence follows fill × (1 − fill)
The documented phenomenon, zero surge at empty, zero at full, a peak somewhere near the middle, is independently established across multiple studies (Yan & Rakheja, 2009; Kolaei, Rakheja & Richard, 2014 to 2017; Biswal et al., 2006). The specific function fill × (1 − fill) is the simplest mathematical form that produces exactly that shape. It is an engineering representation of a confirmed phenomenon, not a formula published in those papers.
Density-linear scaling, K = 3.598 × (density ÷ 7.10)
Follows from F = ma at a fixed volume and deceleration profile: force scales linearly with mass, and mass scales linearly with density. This is a reasonable first-principles assumption, not an explicit published finding.
The 47,000 lb reference payload and the 0.20 divisor
These constants were calibrated specifically to reproduce Budwig's one measured result, 26,480 lbf at 80% fill, 1,000 gallons, 40 mph, CoF 0.60, to within 0.1%. This is calibration against a known test point, not derivation. It is legitimate engineering practice, and it is described accurately here as exactly that.
What's fixed versus what you control when using the calculator
Everything on this page so far describes the model itself: the 47,000 lb reference payload, the 0.20 divisor, and the K constants (3.598, 7.10) are fixed calibration values, the same for every calculation, never adjustable. They are not inputs. Your tank capacity, liquid type and density, fill level, empty vehicle weight, axle and tire counts, road surface or custom coefficient of friction, and GVW limit inputs are fully editable in the calculator and drive every live result. The fixed constants are what make the model consistent; your inputs are what make it yours.
In short: the fill-dependence shape has independent grounding outside of Budwig, and speed has been deliberately removed as a variable based on separate, independent grounding (see above). The model's specific constants are calibrated to Budwig's single measured result. The complete formula, as assembled, is Liquid Surge Control's engineering model, anchored to and validated against Budwig's test, not a formula published in the Budwig report itself.
Illustrative diagram: this figure does not appear in Budwig's report, but is built from the mechanism his report describes
This is the mechanism behind Harmonic Dissonance, the self-cancelling behavior the calibrated model above is anchored to: Surge Busters' floating elements oscillate out of phase with each other, so their individual force contributions (gold, blue, plum) partially cancel when combined into the net force (dashed line). Budwig's tilt-table test measured the result of that cancellation directly, 96.7% less surge force with Surge Busters installed, which is the single measured point every constant in this model is calibrated against.
Why Floating Baffles Work (Core Mechanism)
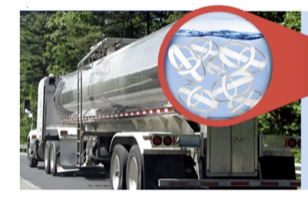
Fixed baffles are welded to the tank wall. When liquid surges into them, the force transfers into the wall, and from there, into the truck. The baffle redirects the force; it doesn't remove it.
Surge Busters float freely. As the wave moves, they move with it, breaking the wave's rhythm into smaller, disorganized eddies that cancel each other out, inside the tank, before the force ever reaches the truck.
This isn't a new idea. It's the same principle that's protected liquid fuel in spacecraft for sixty years.
| Authors | Title | Source | Year | DOI/URL |
|---|---|---|---|---|
| Kang, H.S.; Arif, U.G.M.; et al. | Sloshing suppression by floating baffle | Ocean Systems Engineering | 2019 | doi.org/10.12989/ose.2019.9.4.409 |
| Dodge, F.T. | Engineering Study of Flexible Baffles for Slosh Suppression | NASA Contractor Report | 1971 | ntrs.nasa.gov/citations/19710024808 |
| Stephens, D.G. | Flexible Baffles for the Damping of Fuel Slosh | AIAA/NASA Conference Paper | 1965 | doi.org/10.2514/6.1965-1114 |
| Xie, Y.; Zhao, X. | Sloshing suppression with active controlled baffles through deep reinforcement learning-expert demonstrations-behavior cloning process | Physics of Fluids | 2021 | doi.org/10.1063/5.0037334 |
Note on Xie & Zhao (2021): this paper studies actively, algorithmically controlled baffles (via reinforcement learning), a powered mechanism, not the passive floating design Surge Busters use. It supports the broader principle that baffle motion affects damping, not a direct comparison to Surge Busters' specific mechanism.
Surge Busters float freely and flex against surge energy. They don't transfer force to the tank wall or the truck chassis. Unlike welded baffles, which can only resist forward-back surge, floating baffles respond in every direction.
Why Partial Loads Are the Most Dangerous (The Bell Curve)
Surge force isn't proportional to how much liquid is in the tank. It peaks around 50 to 52% fill, not at full load, and not empty. A truck that "isn't carrying much" is often carrying the worst possible load for surge.
| Authors | Title | Source | Year | DOI/URL |
|---|---|---|---|---|
| Yan, G.; Rakheja, S. | Straight-line braking dynamic analysis of a partly-filled baffled and unbaffled tank truck | Proc. IMechE Part D (SAGE) | 2009 | doi.org/10.1243/09544070JAUTO973 |
| Kolaei, A.; Rakheja, S.; Richard, M.J. | Three-Dimensional Dynamic Liquid Slosh in Partially-Filled Horizontal Tanks Subject to Simultaneous Longitudinal and Lateral Excitations | European J. of Mechanics B/Fluids | 2015 | doi.org/10.1016/j.euromechflu.2015.06.001 |
| Kolaei, A.; Rakheja, S.; Richard, M.J. | An efficient methodology for simulating roll dynamics of a tank vehicle coupled with transient fluid slosh | Journal of Vibration and Control | 2017 | doi.org/10.1177/1077546315627565 |
| Kolaei, A.; Rakheja, S.; Richard, M.J. | Effects of tank cross-section on dynamic fluid slosh loads and roll stability | European J. of Mechanics B/Fluids | 2014 | doi.org/10.1016/j.euromechflu.2014.01.008 |
| Ranganathan, R.; Rakheja, S.; Sankar, S. | Influence of liquid load shift on the dynamic response of articulated tank vehicles | Vehicle System Dynamics | 1990 | doi.org/10.1080/00423119008968941 |
| Biswal, K.C.; Bhattacharyya, S.K.; Sinha, P.K. | Non-linear sloshing in partially liquid filled containers with baffles | Int. J. for Numerical Methods in Engineering | 2006 | doi.org/10.1002/nme.1709 |
Peak braking demand occurs at approximately 50 to 52% fill, not at full load and not at empty. This is why partial loads are the most dangerous, not the heaviest loads. (This is also why the Peak Braking Demand chart's curves peak in the middle rather than at either end.)
Why Fixed Baffles Can't Prevent Rollovers (Lateral Surge)
Fixed baffles run front-to-back. They do nothing about side-to-side motion, the kind that happens during cornering, lane changes, or evasive maneuvers, and the kind most directly tied to rollover risk.
| Authors | Title | Source | Year | DOI/URL |
|---|---|---|---|---|
| Salem, M.I. | Rollover stability of partially filled heavy-duty elliptical tankers using trammel pendulums | WVU Graduate Thesis | 2000 | doi.org/10.33915/etd.2335 |
| Otremba, F.; Romero Navarrete, J.A.; Lozano Guzmán, A.A. | Modelling of a Partially Loaded Road Tanker during a Braking-in-a-Turn Maneuver | Actuators (MDPI) | 2018 | doi.org/10.3390/act7030045 |
| Jalili, M.M.; et al. | Investigation of sloshing effects on lateral stability of tank vehicles during turning maneuver | Mechanics Based Design of Structures and Machines | 2020 | doi.org/10.1080/15397734.2020.1800490 |
| Zheng, X.; et al. | Rollover stability analysis of tank vehicles based on the solution of liquid sloshing in partially filled tanks | Advances in Mechanical Engineering | 2017 | doi.org/10.1177/1687814017703894 |
| Yu, D.; Chu, J. | Study on roll-stability model optimization for partially filled tanker trucks | Advances in Mechanical Engineering | 2019 | doi.org/10.1177/1687814019837805 |
| Salem, M.; Mucino, V.; Gautam, M.; Aquaro, M. | Review of parameters affecting stability of partially filled heavy-duty tankers | SAE Technical Paper | 1999 | doi.org/10.4271/1999-01-3709 |
Traditional fixed baffles offer no protection against the lateral surge forces that cause rollovers. Surge Busters float and respond to forces in all directions, including the lateral forces fixed baffles were never designed to address. Unlike welded baffles, which can only transfer energy and resist forward-back surge, floating baffles respond in every direction and eliminate energy.
Why 96.7% Is the Right Number (Kinetic Energy Dissipation)
The 96.7% figure comes from Budwig's tilt-table test. These papers independently establish that baffle geometry and placement measurably increase sloshing energy dissipation through mechanisms like flow separation and vortex shedding, the general engineering basis for why baffles work at all. They study fixed baffle configurations, not floating ones, so they corroborate that baffles dissipate energy, not the specific magnitude or the floating-versus-fixed comparison. The 96.7% figure, and the claim that a floating design outperforms a fixed one, rest on Budwig's tilt-table measurement alone.
| Authors | Title | Source | Year | DOI/URL |
|---|---|---|---|---|
| Maleki, A.; Ziyaeifar, M. | Sloshing damping in cylindrical liquid storage tanks with baffles | Journal of Sound and Vibration | 2008 | doi.org/10.1016/j.jsv.2007.09.031 |
| Demirel, E.; Aral, M.M. | Liquid sloshing damping in an accelerated tank using a novel slot-baffle design | Water (MDPI) | 2018 | doi.org/10.3390/w10111565 |
| Jung, J.H.; Yoon, H.S.; et al. | Effect of the vertical baffle height on liquid sloshing in a 3D rectangular tank | Ocean Engineering | 2012 | doi.org/10.1016/j.oceaneng.2012.01.034 |
| Popov, G.; Sankar, S.; Sankar, T.S. | Dynamics of Liquid Sloshing in Baffled and Compartmented Road Containers | Journal of Fluids and Structures | 1993 | doi.org/10.1006/jfls.1993.1047 |
Surge Busters eliminate up to 96.7% of kinetic surge energy. The cancellation math itself, floating elements oscillating out of phase and canceling each other's force, works the same way regardless of direction. The 96.7% figure is what that math produced in Budwig's tilt-table test, measured fore-to-aft. The exact percentage of side-to-side force has not been separately measured. (Source: Budwig, R.S. Surge Force Modeling Report. University of Idaho, 2004, the sole source of this figure. The papers above independently confirm that baffle geometry drives meaningful energy dissipation in tanks generally; none of them measure Surge Busters' specific floating mechanism or reach a comparable percentage.)
If liquid has room to move, there is always surge energy being created. However, it is random until a change in direction or speed causes all of the energy to move in one direction. This graph shows how the unorganized energy becomes organized and more powerful. Surge Busters continue to eliminate energy as the force is building, and continue until the force returns to its disorganized state, which the active graph clearly shows.
Supporting Research: The Problem, Independently Documented
These studies don't examine floating baffles specifically. They document the underlying sloshing problem in tank trucks and the conditions that make it dangerous. They establish the problem Surge Busters solve, independent of Surge Busters themselves.
| Authors | Title | Source | Year | DOI/URL |
|---|---|---|---|---|
| Yan, G.; Rakheja, S.; Siddiqui, K. | Experimental Study of Liquid Slosh Dynamics in a Partially-Filled Tank | Journal of Fluids Engineering (ASME) | 2009 | doi.org/10.1115/1.3059585 |
| Wang, Q.; et al. | Liquid sloshing in a tank vehicle: numerical and experimental investigation with baffle configurations | Measurement | 2024 | doi.org/10.1016/j.measurement.2024.114806 |
| Kang, X.; Rakheja, S.; Stiharu, I. | Cargo load shift and its influence on tank vehicle dynamics under braking and turning | Int. J. Heavy Vehicle Systems | 2002 | doi.org/10.1504/IJHVS.2002.001175 |
| Ibrahim, R.A.; Singh, B. | Assessment of ground vehicles tankers interacting with liquid sloshing dynamics | Int. J. Heavy Vehicle Systems | 2018 | doi.org/10.1504/IJHVS.2018.10011110 |
| Huang, W.; Toma, E.; et al. | Evaluation of tank car sloshing effects on rail safety | National Research Council Canada | 2018 | doi.org/10.4224/23003122 |
| Contreras et al. | Analysis of the Reduction of Stability in Partially Filled Tank Vehicles | Tehnički vjesnik | 2021 | doi.org/10.17559/TV-20200321162631 |
Foundational References: Why This Field Is Taken Seriously
Liquid slosh control isn't a niche concern invented for tank trucks. It's a flight-critical engineering discipline. The same physics that keeps liquid fuel and oxygen stable in spacecraft applies, at smaller scale, to a half-full tank on the highway.
| Authors | Title | Source | Year | DOI/URL |
|---|---|---|---|---|
| Ibrahim, R.A. | Liquid Sloshing Dynamics: Theory and Applications | Cambridge University Press | 2005 | doi.org/10.1017/CBO9780511536656 |
| Dodge, F.T. | The New Dynamic Behavior of Liquids in Moving Containers | Southwest Research Institute | 2000 | www2.swri.org/www2/fluid-slosh/slosh-dynamics.htm |
| Strahan, A.; et al. | Slosh Baffle Design and Test for Spherical Liquid Oxygen and Liquid Methane Propellant Tank for a Lander | AIAA SPACE Conference | 2011 | doi.org/10.2514/6.2011-5633 |
| VanZwieten, T.S.; et al. | Nonlinear Slosh Damping Testing and Analysis for Launch Vehicle Propellant Tanks | AIAA SciTech Forum | 2020 | doi.org/10.2514/6.2020-2050 |
| Yang, H.Q.; et al. | Development of A Maximum Anti-Slosh Baffle Pressure Load Model | NASA/AIAA technical paper | 2023 | ntrs.nasa.gov/citations/20230005181 |
Title may vary slightly at the source. Worth verifying before publishing that this is the same paper.
Want to Keep Going?
→ Read the summary: The Science Behind the 96.7%
→ See how this compares to welded baffles: Baffle Comparison
→ Download the Peak Braking Demand research summary (PDF)
→ See the full worked calculation: Emergency Braking Force Analysis: Calculation Reference
Get Surge Busters →